Overview: I wanted to learn more about Citi Bike's data and I was thinking that they have become
very popular in recent years and their usage have increased drastically over time. I used the data that
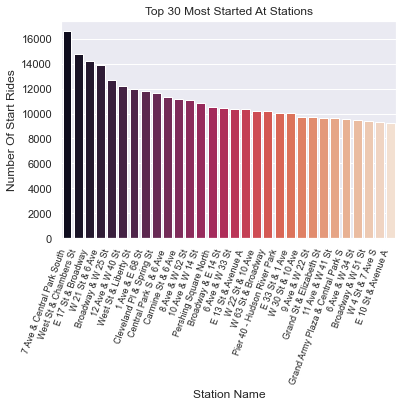
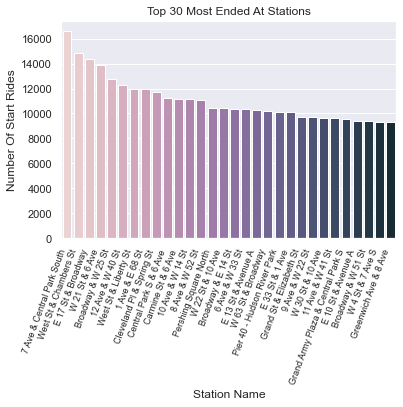
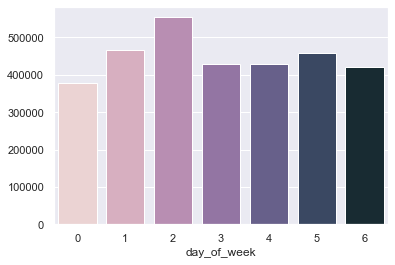
is provided by Citi Bike and i used it to see how frequently are their bikes used and in what days are they
used the most in and which are the most popular stations. It was surprising to see the amount of Citi Bikes that
get used daily and yearly
Data: I only used one dataset from Citi Bike and it was the data from the month of June in the year
2020.
The data had features like which station the bike started at and ended at and what time it started and the time
it ended. Those in my opinion were the most important features out of the dataset. Although the data was already
well-kept, I wanted to look at the data and group them based on the borough of the station but my approaches either
took way too long to execute, using geopy, or did not work at all.
Techniques: I used mostly pandas since i needed to work with the data frame and i was able to
display and group the data
based on what I needed. I was able to use datetime to covnert the timestamps in the dataset and extract the
day of the week from them. Seaborn and Matplotlib were very useful in plotting the data that wanted to show
and made the graphs look presentable. Seaborn's visualization was very impressive and it definitely mad things a
lot
easier.